-
Research Services
Providing actionable insights so you can learn, innovate and scale the right ideas
Whether launching or evolving a new product or service, we’ll put a strategic eye to your consumer research, gather reliable quantitative and qualitative data, identify the right opportunities, and provide you with scalable strategies.
-
Design Services
Creating simplified digital product design and engaging experiences
The gotomedia UX Design Team uses a range of disciplines within the UX umbrella to create effective products, including user interface design, interaction design and visual design.
-
Featured Work
-
buyer journeys & customer personas
-
building cohesive enterprise strategy & design
-
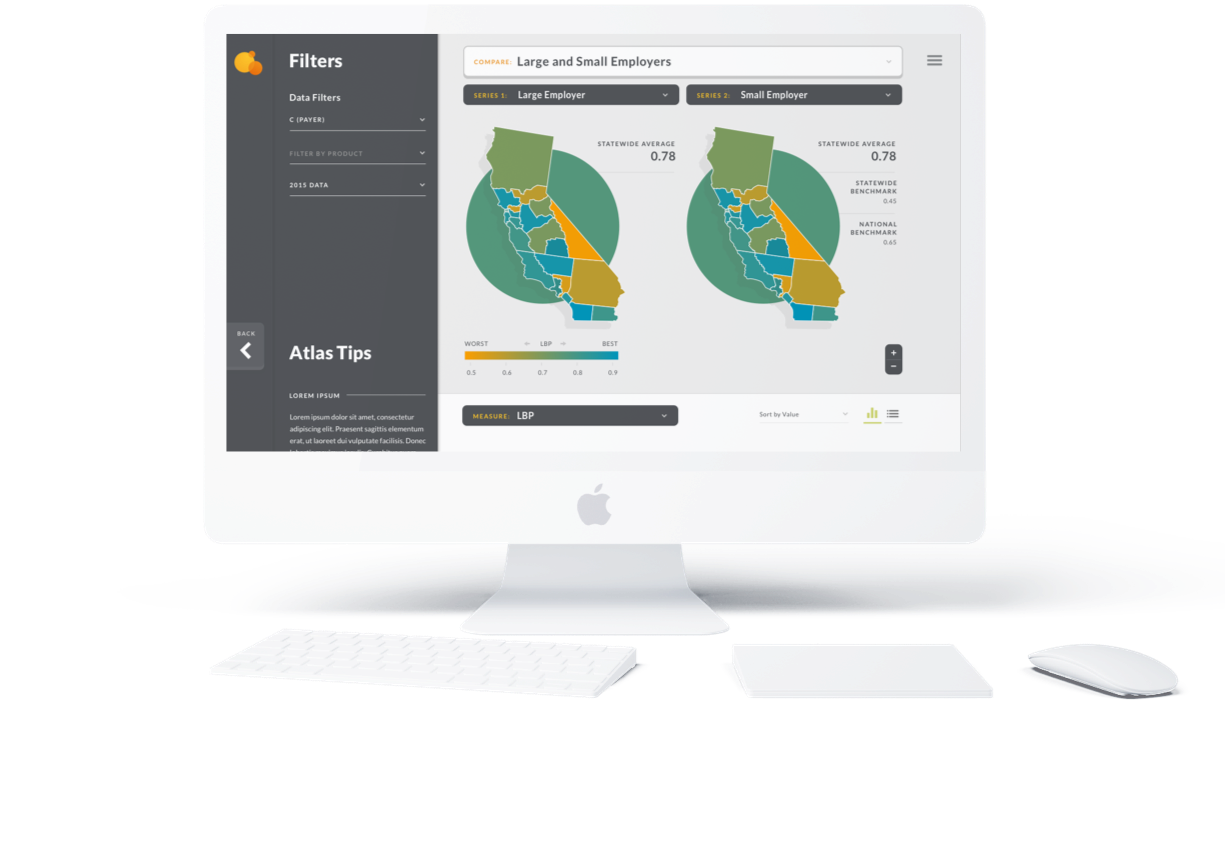
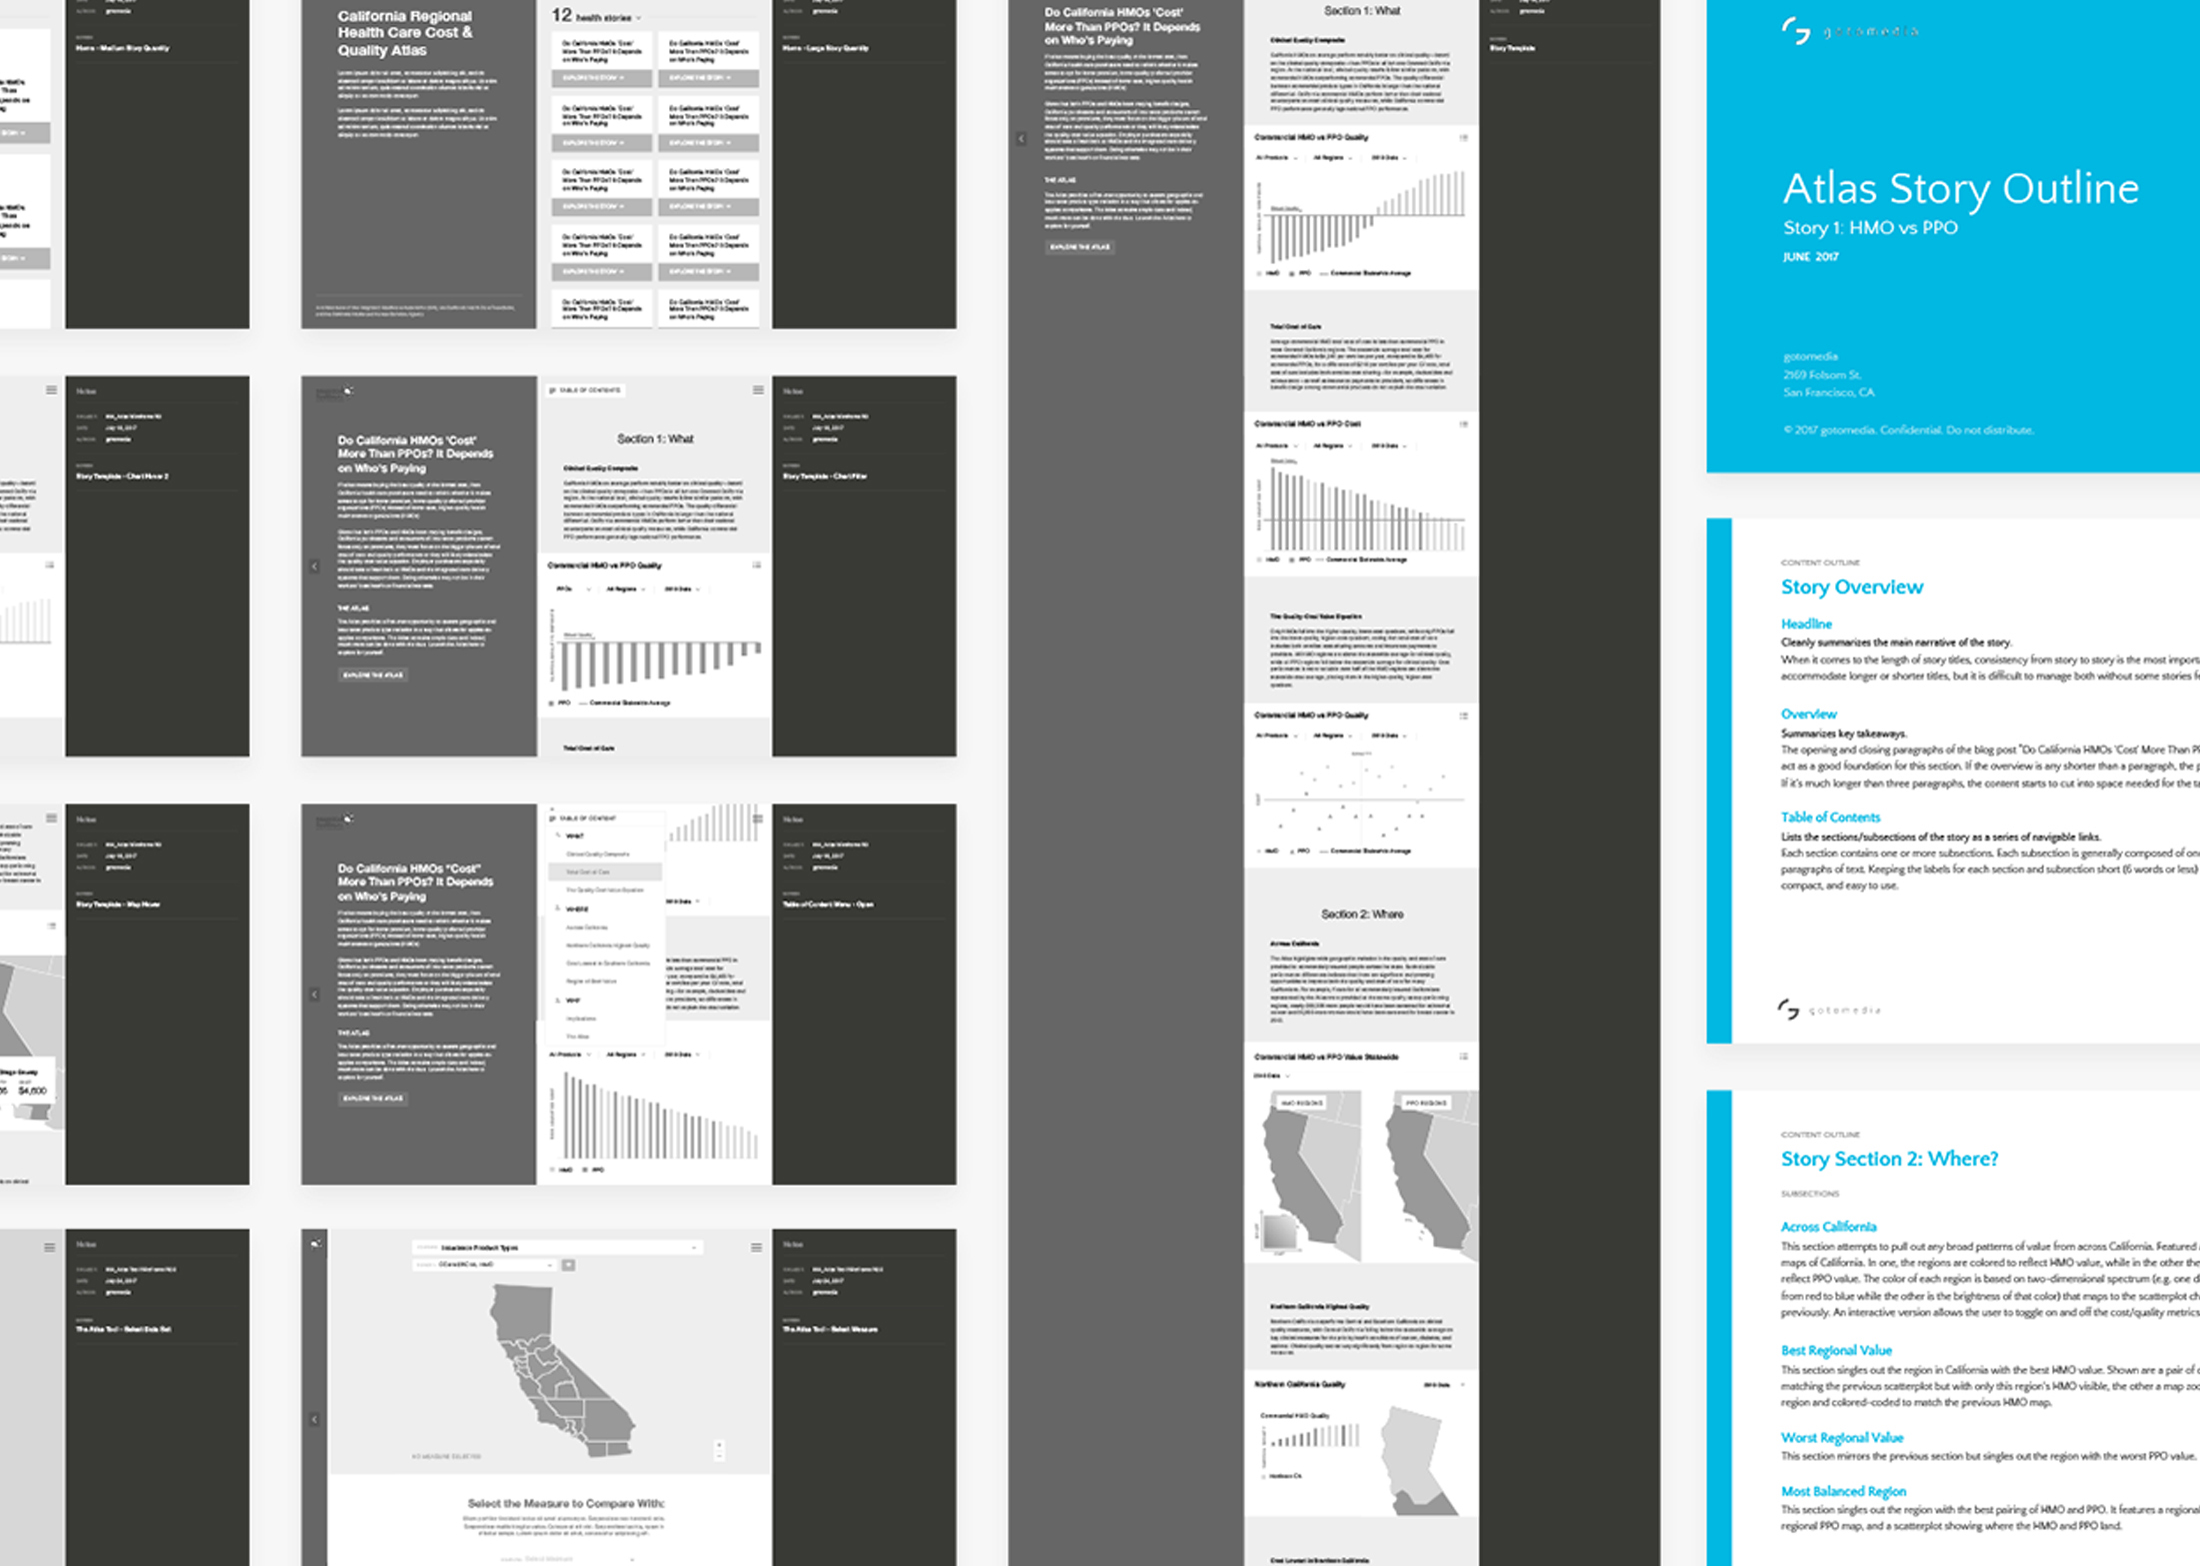
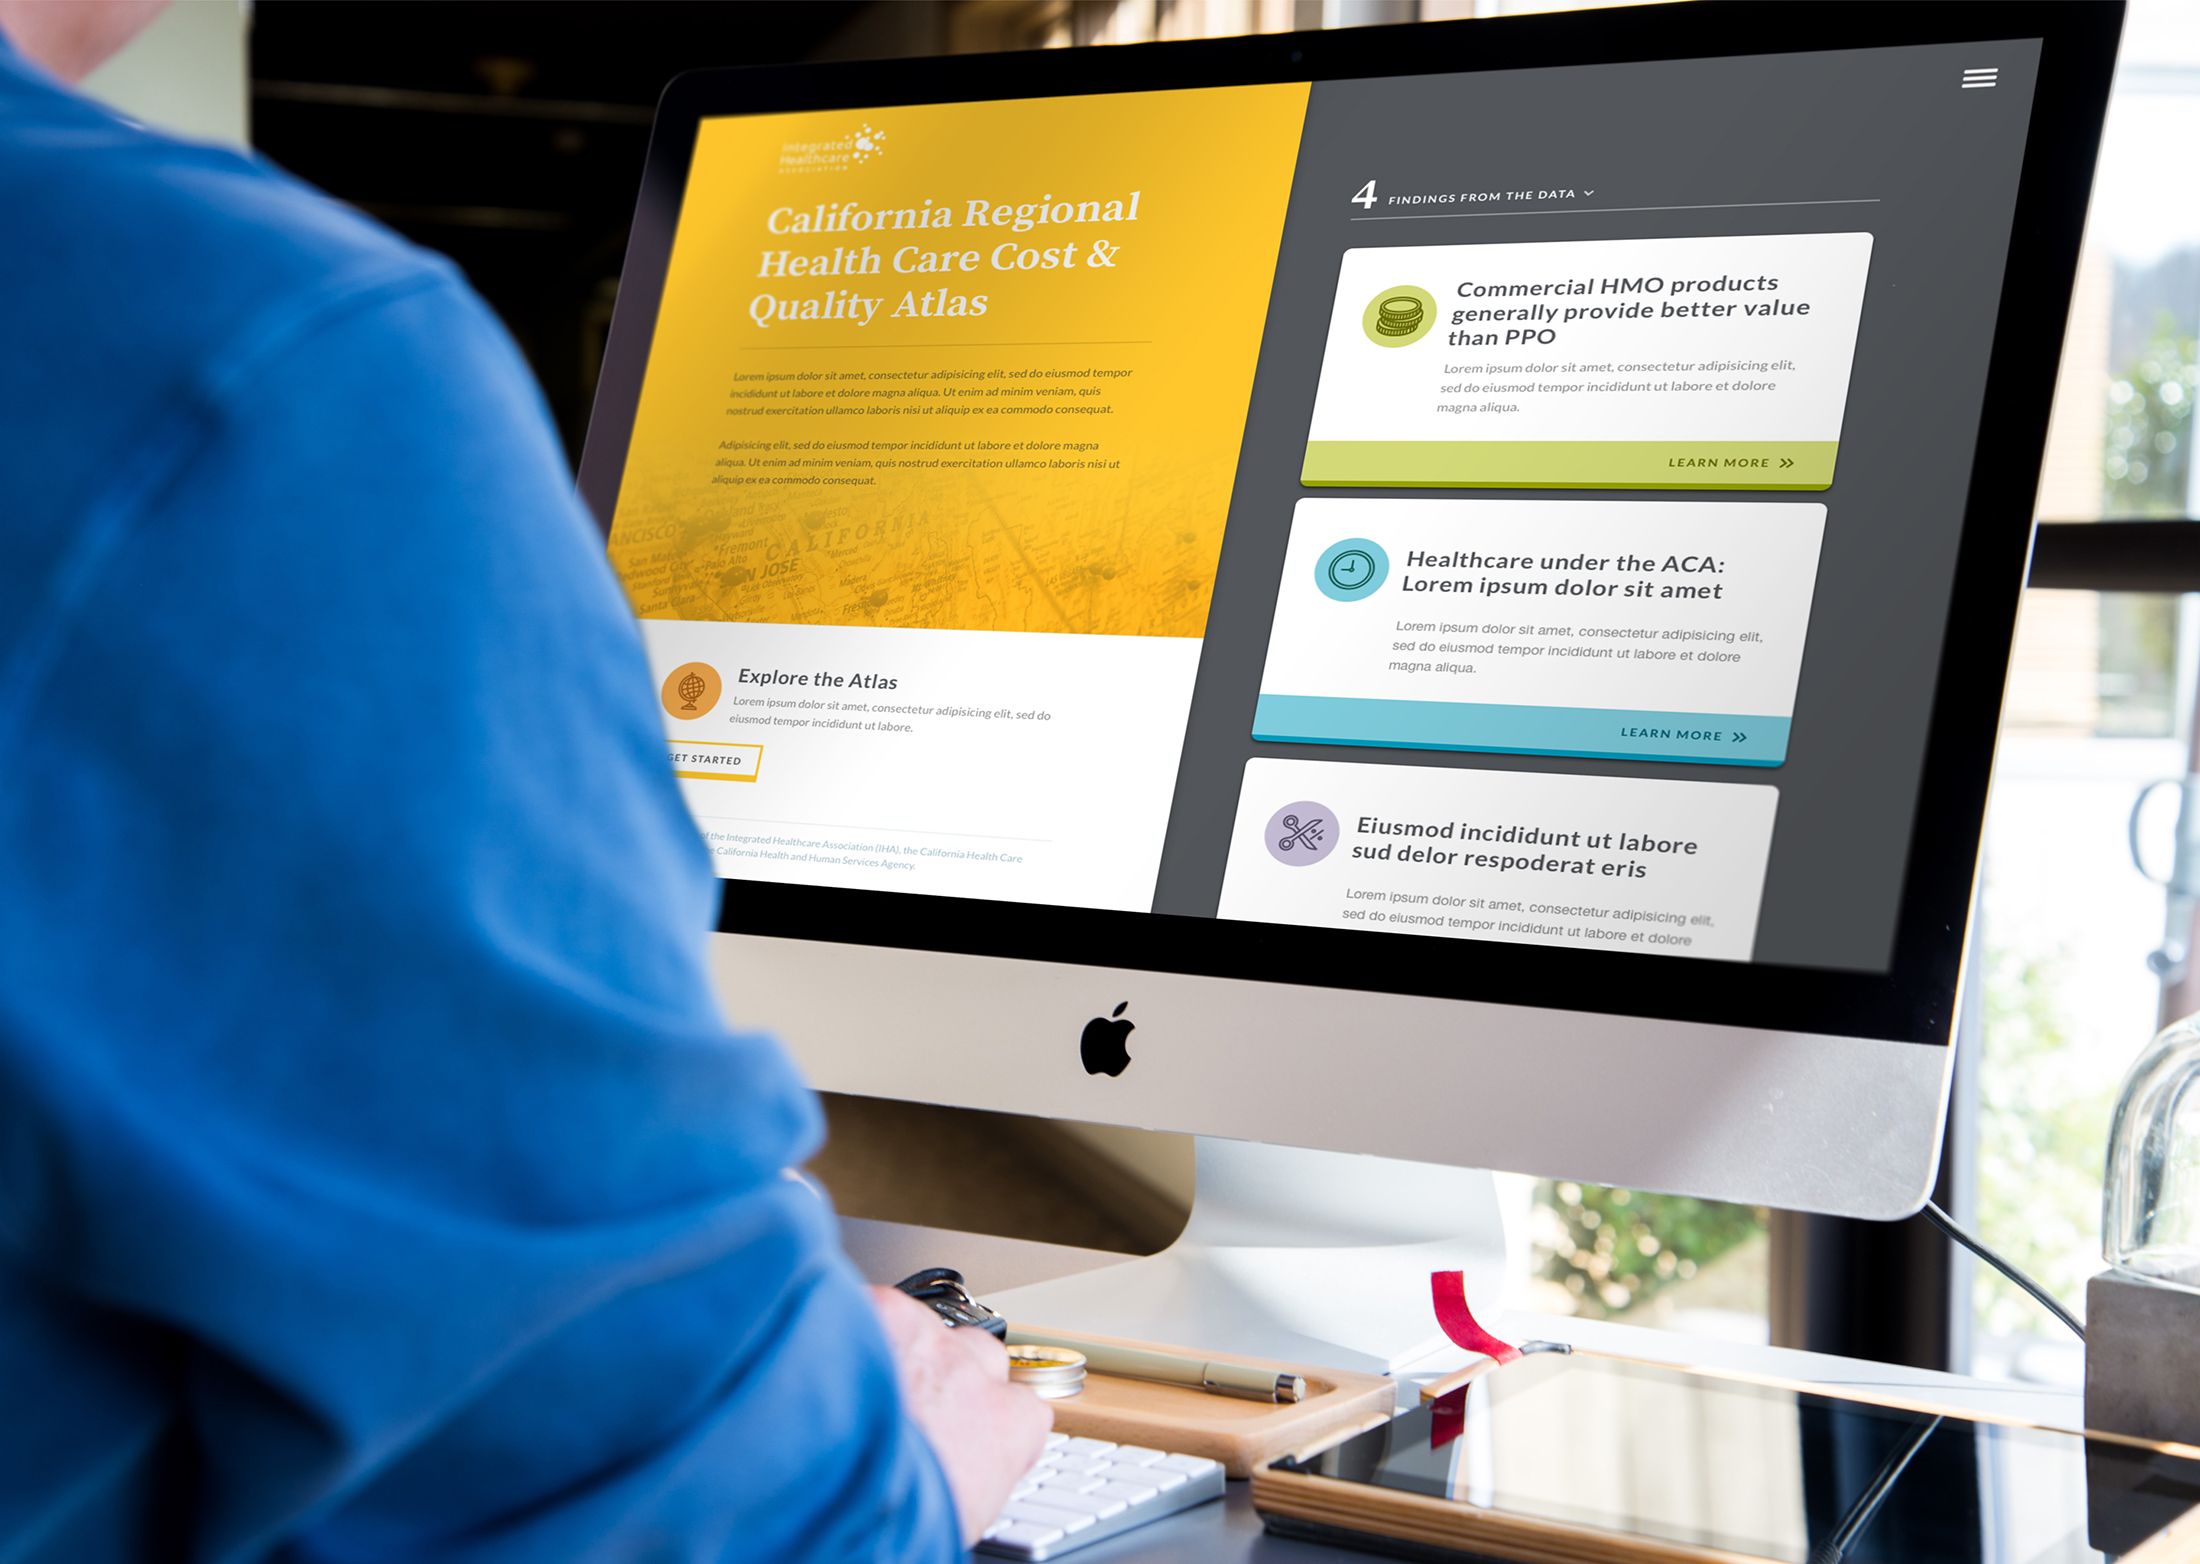
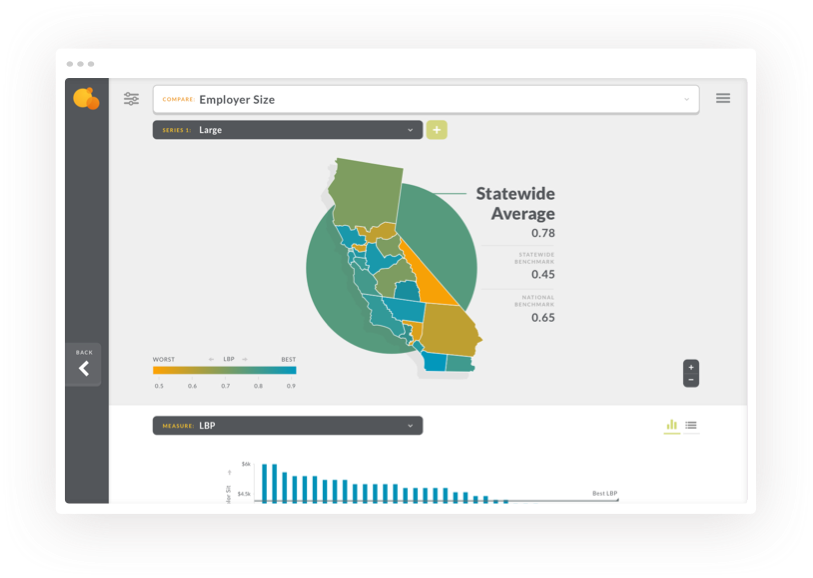
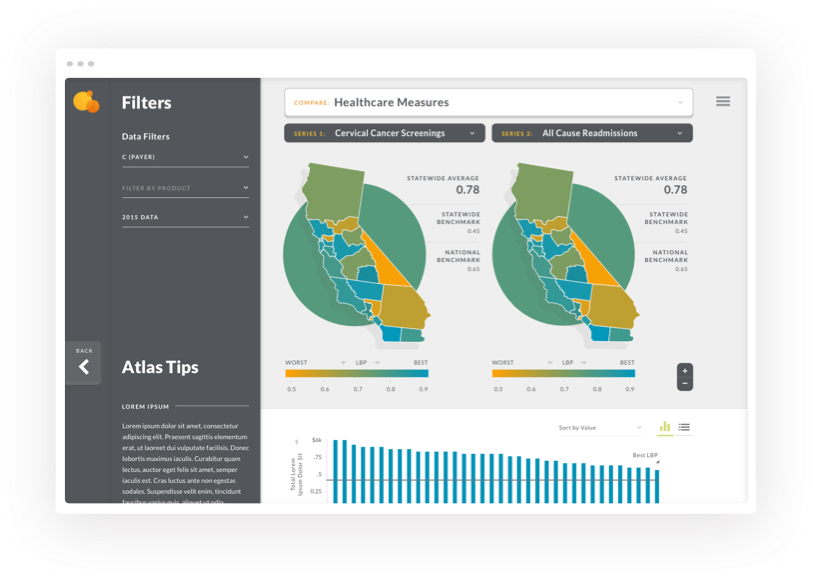
accessible and extensible UX for complex data
-
conversational design for an international audience
-
-
Our Focus
Redefining the future of user experience
At gotomedia, we create memorable experiences across technology, medical devices, healthcare, and accessibility. With an evolving tech landscape, healthcare complexities, and the importance of inclusive design, our human-centric approach ensures functional and delightful solutions.
-
reimagining the customer journey
-
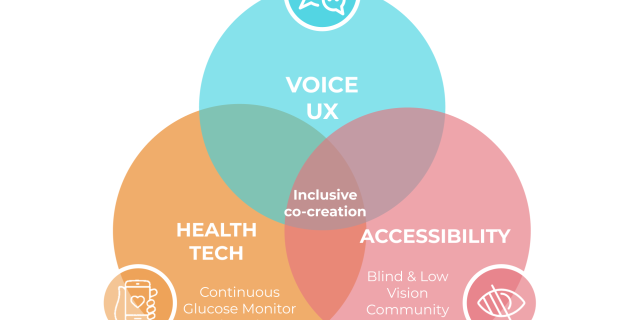
creating inclusive digital experiences
-
-
The Latest From Gotoblog


